


Evaluation of different larval instars and predator-prey release ratio of indigenous generalist predator, common green lacewing, Chrysoperla carnea, for the management of two-spotted spider mite, Tetranychus urticae, on cucumber, Cucumis sativus crop in greenhouses
Ali, Hafiz Muhammad Sajid  1
; Kamran, Muhammad
2
and Alatawi, Fahad Jaber
3
1
; Kamran, Muhammad
2
and Alatawi, Fahad Jaber
3
1Department of Plant Protection, College of Food and Agriculture Sciences, King Saud University, Riyadh 11451, Saudi Arabia.
2Department of Plant Protection, College of Food and Agriculture Sciences, King Saud University, Riyadh 11451, Saudi Arabia.
3✉ Department of Plant Protection, College of Food and Agriculture Sciences, King Saud University, Riyadh 11451, Saudi Arabia.
2025 - Volume: 65 Issue: 3 pages: 841-853
https://doi.org/10.24349/lf2w-eh0cOriginal research
Keywords
Abstract
Introduction
The common green lacewing, Chrysoperla carnea (Stephens) (Neuroptera: Chrysopidae), is an efficient generalist predator used to manage different soft-bodied insect pests such as aphids, whiteflies, thrips, mealybugs, etc. (Gautam and Tesfaye 2002). Chrysoperla carnea is seeking more attention than other potential biocontrol agents due to its high voracity, adequate searching ability, broad food spectrum, wide distribution, high adaptability to the arid climates, prevailing in the Kingdom of Saudi Arabia (SA), and well-established mass-rearing techniques (Sattar et al. 2011; Tauber and Tauber 1993; Tauber et al. 2000).
Chrysoperla carnea has been found in different regions of SA (Hölzel 1980; Alghamdi and Sayed 2017; Letardi et al. 2020), in association with various spider mite pests on different cultivated and wild vegetations (unpublished data of Acarology and Biological Control Research and Development Laboratory). Tetranychus urticae Koch (Acari: Tetranychidae) is the major pest of greenhouse-grown crops in the country (Alatawi 2011; Alatawi and Kamran 2018), and its management is necessary. For developing effective biological control, understanding the effect of different developmental stages of insect predators on pest management is very crucial (New 2002). Each life stage of an insect predator has distinct features, such as incubation period, handling time, consumption rate, searching ability, etc. that influence its predation efficiency (New 2002). The larvae of C. carnea are the only stage that predate on insect pests and are known as aphid lions (Tauber et al. 2000). Chrysoperla carnea eggs are released using egg-cards, while larvae are released either by singly or automated motorized machine mixed with bran or rice husk (Tauber et al. 2000).
Some recent studies have documented the efficiency of C. carnea as a biocontrol agent of soft-bodied insect pests with a different release ratio of both eggs and larvae in the field (Iqbal et al. 2008; Zia et al. 2008; Khan et al. 2012; Sarwar 2013, 2014), and greenhouses (Alghamdi and Sayed 2017; Salama et al. 2016). Few studies have accounted for the management of spider mites by releasing C. carnea larval stage (Mena et al. 2020; Imam and Nawar 2020; Wafaa and Eid 2008; Saleh et al. 2017). However, T. urticae management on economic greenhouse crops by releasing C. carnea is scarcely studied.
Keeping in view the importance of the locally adapted predator to the prevailing conditions of SA, the aim of this research was: 1) to elucidate the optimal stage (eggs or larvae) of C. carnea to release and, 2) to evaluate the efficiency of C. carnea predator stage with different predator-prey release ratios for the management of T. urticae on Cucumis sativus L. (Cucurbitaceae) crop in the greenhouse.
Materials and Methods
Predator and prey collections and identification
The population of Chrysoperla carnea used in experiments was taken from the mass-reared colony of the predator at the Acarology and Biological Control Research and Development Laboratory (ABRL), Department of Plant Protection, King Saud University (KSU). Chrysoperla carnea was collected initially from Washingtonia filifera (Rafarin) H.Wendl. (Aceraceae) using an aerial net in February 2020 from the vicinity of KSU campus and has been reared in ABRL for three years. The identification was confirmed by taxonomists/ experts at the KSU, Museum of Arthropods (KSUMA), Department of Plant Protection, College of Food and Agriculture Science (CFAS), KSU, and the voucher specimens were preserved in 75% ethanol. The C. carnea larvae were reared by using plastic cups (90ml). A single fresh egg was placed in each plastic cup. As the first larval instar emerged, eggs of Ephestia cautella (Walker) (Lepidoptera: Pyralidae) were provided daily. The distinction between the 1st, 2nd, and 3rd instar larvae were made by the exuvia of larvae.
Tetranychus urticae population used in current experiments was collected from eggplants grown in the greenhouse in the vicinity of KSU during April 2022. A few collected specimens were brought in laboratory and mounted on (1-1.2mm thick) glass slides (25.4×76.2mm) under SZX10 stereomicroscope (Olympus, Tokyo, Japan), for species identification with the help of available taxonomic literature (Jeppson et al. 1975). After identification, voucher glass slide-mounted specimens were deposited in the Acarology laboratory at KSU. For mass rearing, few individuals were released on the 3-4 leaf stages C. sativus plants inside the growth chamber (Memmert HPP750eco) at 25 ± 2 °C, 35 ± 5% RH, and 14:10 h L: D photoperiod.
Preparation of Cucumis sativus seedlings
Cucumis sativus seeds of Beth Alpha variety (Italy: Reg # S0003043004500018), were sowed in pots with dimension 16 x 15 x 16cm (Ward, UK) filled with European standard peatmoss, and potting soil (Factory of Saudi Soil Development Company, Saudi Arabia), with a 2:1 ratio, respectively. The pots were placed in a controlled growth chamber (Memmert HPP750eco) at 25 ± 2 °C, 35 ± 5% RH, and 14:10 h L: D photoperiod and irrigated regularly to get seedlings. The seedlings were transferred to the new big sized pots 22 x 22 x 17cm (Ward, UK) when they reached the first true leaf stage. Then, pots moved to the greenhouse and placed them in cages (Bio Quip, USA) to avoid unwanted insect pest infestation.
Experimental procedures
Ten females and two males of T. urticae were placed onto each 6-8 leaf C. sativus plant with a camel hairbrush. After 15 days, the mite population was estimated by randomly selecting three leaves from the upper, middle, and lower parts of each plant. All treatments were organized in the greenhouse following a randomized complete block design (RCBD) with 45 cm plant-to-plant and 60 cm with block-to-block distance. This ensured that the plant leaves did not touch the adjacent plants, and both predator and pest individuals were entirely restricted to the respective experimental units. In Experiment 1, different developmental stages (egg and larval instars) of the predator were released on the plants corresponding to the treatments. Whereas, in Experiment 2, varying numbers of the 2nd instar larvae were released based on their predator-prey release ratios. The eggs and larval instars used in the experiment were >12 hours old. The eggs were acquired from the stock culture, pasted on egg cards and were directly used in the experiment. For acquiring different larval instars of the predator, a total of 200 eggs of C. carnea for each larval instar (total 600 eggs for three instars) were placed separately in each plastic cup (90ml) at different time intervals based on the differences in their developmental period i.e. three, six and eight days for 1st, 2nd, and 3rd instar, respectively (Shakoor et al. 2024). It was done so that all three larval instars could be available simultaneously for the experiment, i.e. rearing of 1st, 2nd, and 3rd larval instars started at 12, nine and seven days of mite inoculation. A suitable amount of E. cautella eggs were provided as food to the neonate larvae of C. carnea. The distinction among the larval instars (1st, 2nd, and 3rd) was made by the exuviae of each instar. After 15 days of T. urticae inoculation, C. carnea was brought to the greenhouse in plastic cups and was released on their respective treatments with the camel hairbrush. The plants were placed on the inverted plate submerged inside the large plate to prevent the predator from escaping. All motile stages of T. urticae were recorded after four, eight, and 12 days of predator release by randomly selecting three leaves from the upper, middle, and lower parts of each plant. All observations were performed using 24x hand lens. The required population of the predator was calculated according to the following equation (Wafaa and Eid 2008):
Experiment 1. Impact of releasing different developmental stages (egg and three larval instars) of Chrysoperla carnea for management of Tetranychus urticae
This experiment was conducted from February to April 2023 in the greenhouse of the Plant Production Department, CFAS, KSU. The average temperature and relative humidity inside the greenhouse during the experiment were recorded as 21 ± 0.6 °C and 59 ± 1.5%, respectively. Temperature and relative humidity data in all experiments were collected with HOBO environmental monitors (Onset Computer Corporation, Bourne, MA, USA).
After the estimation of the T. urticae population, 15 days after inoculation, different stages of a predator, C. carnea, were released with a prey release ratio of 1:20 in all treatments with the camel hairbrush. The treatments were: T1 with the release of only egg cards, T2 with only 1st instar larvae, T3 with only 2nd instar larvae, T4 with only 3rd instar larvae, and T5 without predator release (Control). Each treatment was replicated five times. The egg cards, approximately 6 cm long and 4 cm wide, were hung with the C. sativus leaves in treatment T1 . The 1st, 2nd, and 3rd instar larvae were released on T2 , T3 , and T4 , respectively. The eggs hatching was verified during the experiment after observing the white stalked eggshells on the egg's cards and the presence of 1st instar larvae on the plants in T1 . Furthermore, the presence of C. carnea larvae on the plants were observed throughout the experiment. All the instars consistently remained on the plants within their respective treatments.
Experiment 2. Impact of releasing different predator-prey release ratios of Chrysoperla carnea, against Tetranychus urticae
This experiment was conducted from September to November 2023 in the greenhouse of the Education Farm of KSU. The temperature and relative humidity inside the greenhouse during the experiment was recorded as an average of 24 ± 0.5 °C. and 57 ± 1.7% respectively. Four treatments represented three predators-prey release ratios and control treatment. The treatments were: T1 with a predator-prey release ratio of 1:30, T2 with a predator-prey release ratio of 1:60, and T3 with a prey-release ratio of 1:90, and T4 without predator release (Control). Each treatment was replicated 15 times.
Damage rate assessment
For both experiments, the damage rate caused by T. urticae to the C. sativus plant leaves was evaluated by visual observation based on damage symptoms/stippling/yellow spots and webbing density on the leaves. The damage rate was categorized into three levels, with stippling appearing/yellow spots on (Suekane et al. 2012): (a) less than one-third of the leaf, (b) half of the leaf, and (c) more than half of the leaf/complete discoloration of the leaf. The webbing density was categorized into four levels: (a) localized/scattered webbing over the leaf, (b) webbing over the whole leaf, (c) webbing over leaves and leaves petioles, and (d) upper half of the plants covered with webbing.
Statistical analysis
The data obtained on T. urticae population size from both experiments were analyzed using a one-way ANOVA following a Randomized Complete Block Design (RCBD). Prior to analysis, data were analyzed for normality and homogeneity of variance using Kolmogorov-Smirnov test and Levene's test, respectively. The data for the effect of different developmental stages of predator on the T. urticae population in different stages (within as well as among the treatments after each sampling) were transformed using log transformation. The means of untransformed data are presented in Table 1. Means were compared using Fisher's least significant difference (LSD) at P ≤ 0.05. The observed damage symptoms and webbing density produced by T. urticae were comparatively investigated on C. sativus plants and were statistically analyzed through non-parametric Kruskal-Walli's test. The mean scores were ranked by the Wilcoxon rank-sums test. Additionally, photographs related to observations of damage symptoms were captured by the Canon 700D DSLR camera (Canon, Japan). All analyses were run using the Computer Software SAS v.9.2 (SAS Institute, USA). The T. urticae population reduction percentage as compared to the control treatment was analyzed following the Abbott formula (1925):
Results
Experiment 1. Impact of releasing different developmental stages (egg and three larval instars) of Chrysoperla carnea for management of Tetranychus urticae
At predator-prey release ratio of 1:20, larval releases of C. carnea in its different instars were comparatively effective than using egg cards to manage the T. urticae population on C. sativus plants in the greenhouse. The larval instar releases significantly suppressed the T. urticae population and reduced the damage rate than using egg cards (F = 7.431, DF = 4, P ≤ 0.05) (Tables 1 and 2; Figure 1). The blocking had a significant effect on T. urticae population reduction and its damage rate after four (P = 0.0125) and eight (P = 0.0034) days of predator release. The highest T. urticae population reduction percentage of 79% was found within eight days after the release of 3rd instar larvae. Afterward, the average population of T. urticae increased up to (132.3 ± 32.7) motiles per plant in 12 days (Table 1). Similarly, a 64% population reduction percentage of T. urticae was observed, with an average mean population of (76.8 ± 13) motiles per plant after 12 days of 2nd instar release. Furthermore, The T. urticae population reduction gradually increased with the release of 1st instar larvae, reaching 47% after 12 days (Table 1). In the control plants, without predator release, the highest T. urticae population was (313.8 ± 49 motiles per plant), with severe leaf damage by the T. urticae population characterized by stippling, discoloration, and webbing (Tables 1 and 2). The population reduction percentage in all treatments was calculated relative to the control.
Download as Means followed by different capital letters within the column are significantly different (RCBD followed by LSD test: P≤0.05). Means followed by different small letters within the row are significantly different (RCBD followed by LSD test: P≤0.05)
Treatments (Ts)
TIME (Days)
At the time of predator release
After four days
After eight days
After 12 days
Egg (T1)
141.60 ± 12.8 b
220.4 ± 29 a, A
244.2 ± 35 a, A
259.8 ± 32 a, AB
–
–
0.22
0.17
1st instar larvae (T2)
141.60 ± 12.8 a
194.4 ± 40 a, A
185.4 ± 50 a, B
167.4 ± 24.4 a, BC
–
0.05
0.41
0.47
2nd instar larvae (T3)
141.60 ± 12.8 b
104.8 ± 25 a, B
76.8 ± 13 b, C
111.6 ± 11a, C
–
0.49
0.75
0.64
3rd instar larvae (T4)
141.60 ± 12.8 a
50.4 ± 6 b, C
64.2 ± 17 b, C
132.00 ± 38.4 a, C
–
0.75
0.79
0.66
Control (T5)
141.60 ± 12.8 c
204.4 ± 22 b, A
311.6 ± 52 a, A
313.8 ± 49 a, A
Damage assessment
Download as Ranks for Visual observation: Stippling appeared on; 1 = less than one-third of the leaf, 2 = half of the leaf, and 3 = more than half of the leaf/Complete discoloration of the leaf. Ranks for Webbing density: 1 = localized/scattered webbing, 2 = webbing over the whole leaf, 3 = webbing over the complete leaf and side branch/es, and 4 = upper half of the plants covered with webbing.
Treatments
Visual observation
Webbing density
At the time of predator release
Final observation
At the time of predator release
Final observation
Eggs (T1)
1
2
1
2
1st instar larvae (T2)
1
2
1
2
2nd instar larvae (T3)
1
1
1
1
3rd instar larvae (T4)
1
2
1
2
Control (T5)
1
3
1
4
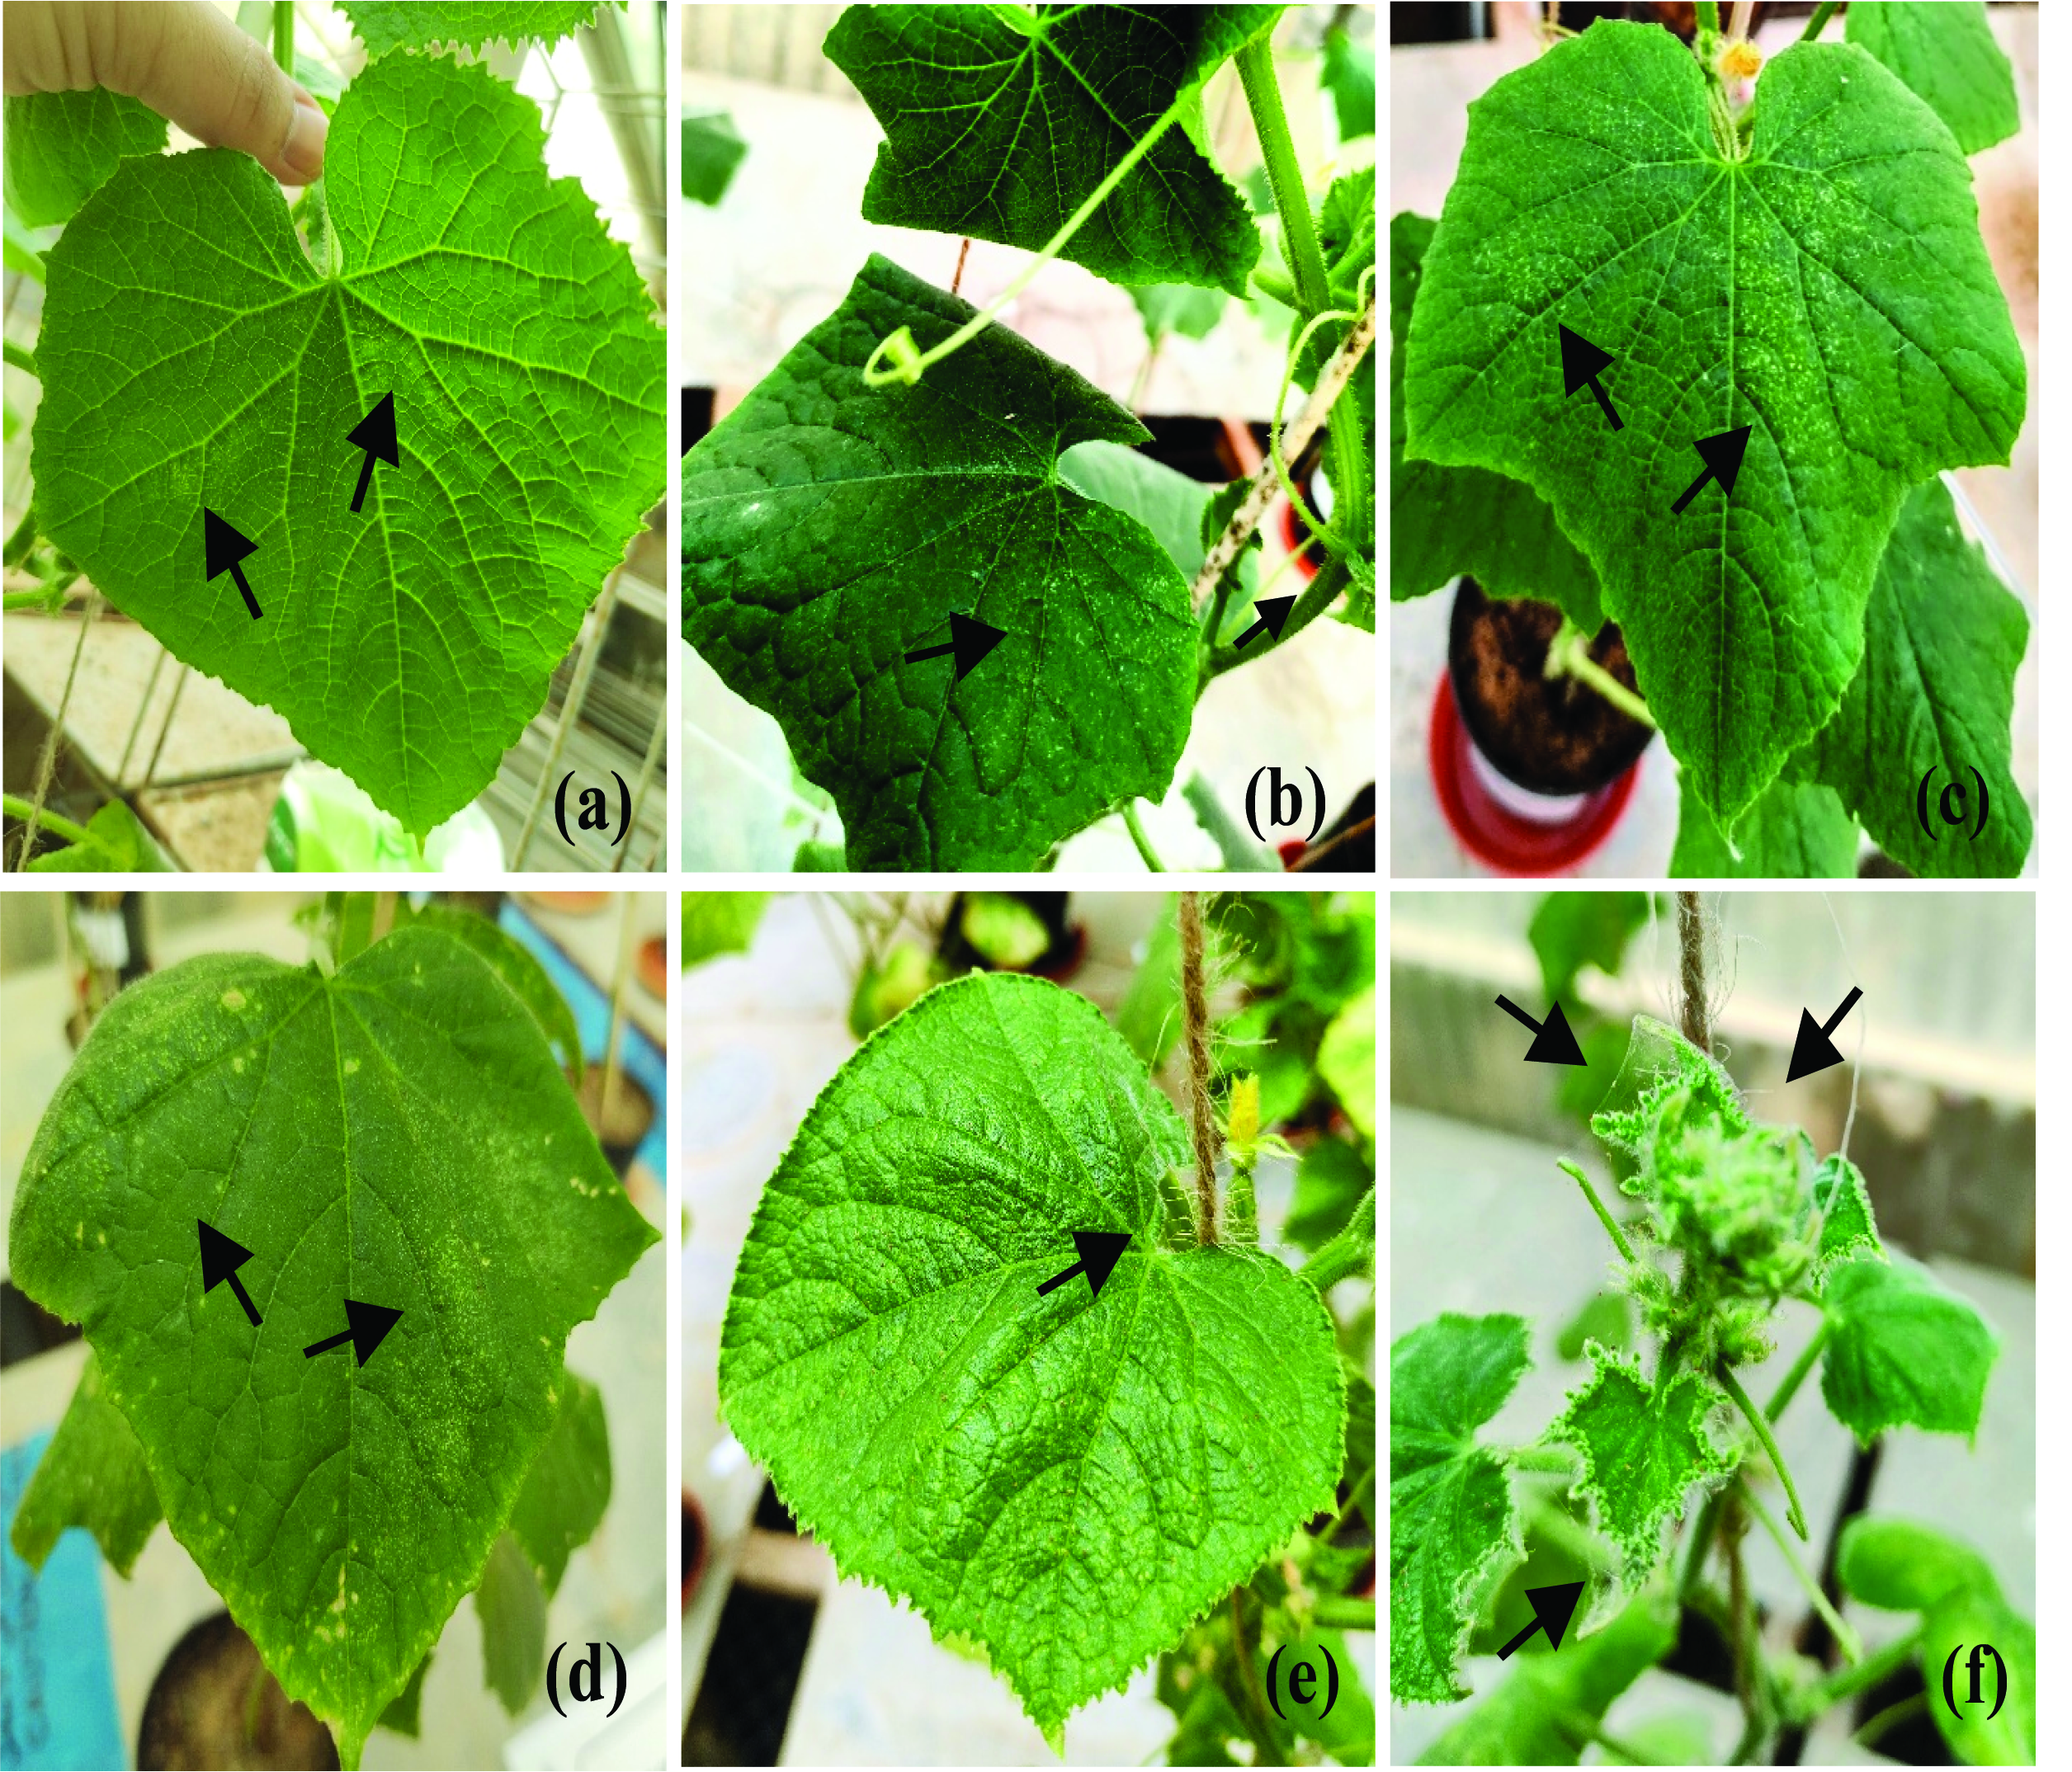
The stippling that appeared on the C. sativus leaves by the T. urticae population was less than one-third of the leaf (rank 1) in all treatments, including control at the time of predator release (Table 2). After 12 days of predator release, stippling increased to half of the leaf (ranks 2) in the treatments where egg cards, 1st and 3rd instar larvae were released. While it remained less than one-third of the leaf (rank 1) where 2nd instar larvae were released (Table 2). Either complete leaf discoloration or stippling of more than half of the leaf (rank 3) was observed in the control treatment (Figure 1). The webbing constructed by the T. urticae population on the C. sativus leaves was localized/scattered on all plants, including control (rank 1), at the time of predator release. During final observations, the webbing density increased on all plants (rank 2), except where the 2nd instar larvae were released. Localized/scattered webbing (rank 1) was observed. The upper half of the plants were covered with webbing (rank 4), in the control treatment, produced by the T. urticae population (Figure 1).
Experiment 2. Impact of releasing different predator-prey release ratios of Chrysoperla carnea, against Tetranychus urticae
The release of C. carnea 2nd instar larvae with three different predator-prey release ratios of 1:30, 1:60, and 1:90 significantly (F = 4.47, DF = 3, P >0.0001) reduced the mean population growth rate of the T. urticae (Table 3) and its damage to the C. sativus plants leaves as compared to the control after 12 days of larval release. (Table 4 and Figure 2). The blocking showed a statistically significant (F = 4.343, P = 0.04) effect on T. urticae population reduction percentage and its damage after 12 days of 2nd instar release. The 2nd instar larvae significantly (P >0.0001) reduced the population growth rate in all three release ratios. However, the highest population reduction (66%) was significantly higher with the release ratio of 1:30 with an average mean population of (116 ± 19.19) motiles per plant followed by a ratio of 1:60 (61%) with (132.27 ± 09.68) as compared to a ratio of 1:90 (24%) with (255.73 ± 13.02), respectively (Table 3). In the control treatment, the highest average mean population (336.53 ± 18.39) motiles per plant was observed (Table 3).
Download as Means followed by different capital letters within the column are significantly different (RCBD followed by LSD test: P≤0.05). Means followed by different small letters within the row are significantly different (RCBD followed by LSD test: P≤0.05).
Predator-prey ratios
Before predator release
TIME (Days)
After four days
After eight days
After 12 days
T1 (1:30)
117.07±4.18 a
101.60±10.31 a, B
109.27±15.23 a, C
116.00±19.19 a, C
0.54
0.57
0.66
T2 (1:60)
117.07±4.18 a
104.53±09.17 a, B
117.13±14.02 a, C
132.27±09.68 a, C
0.53
0.54
0.61
T3 (1:90)
117.07±4.18 c
194.40±16.74 b, A
205.93±18.50 b, B
255.73±13.02 a, B
0.13
0.19
0.24
T4 (Control)
117.07±4.18 c
223.00±13.51 b, A
253.33±11.40 b, A
336.53±18.39 a, A
Damage assessment
Download as Ranks for Visual appearance: Stippling appeared on; 1 = less than one-third of the leaf, 2 = half of the leaf, and 3 = more than half of the leaf/Complete discoloration of the leaf. Ranks for Webbing density: 1 = localized/scattered webbing, 2 = webbing over the whole leaf, 3 = webbing over the complete leaf and side branch/es, and 4 = upper half of the plants covered with webbing.
Treatments
Visual appearance
Webbing density
At the time of predator release
Final observation
At the time of predator release
Final observation
T1 (1:30)
1
1
1
1
T2 (1:60)
1
2
1
1
T3 (1:90)
1
2
1
2
T4 (Control)
1
3
1
3
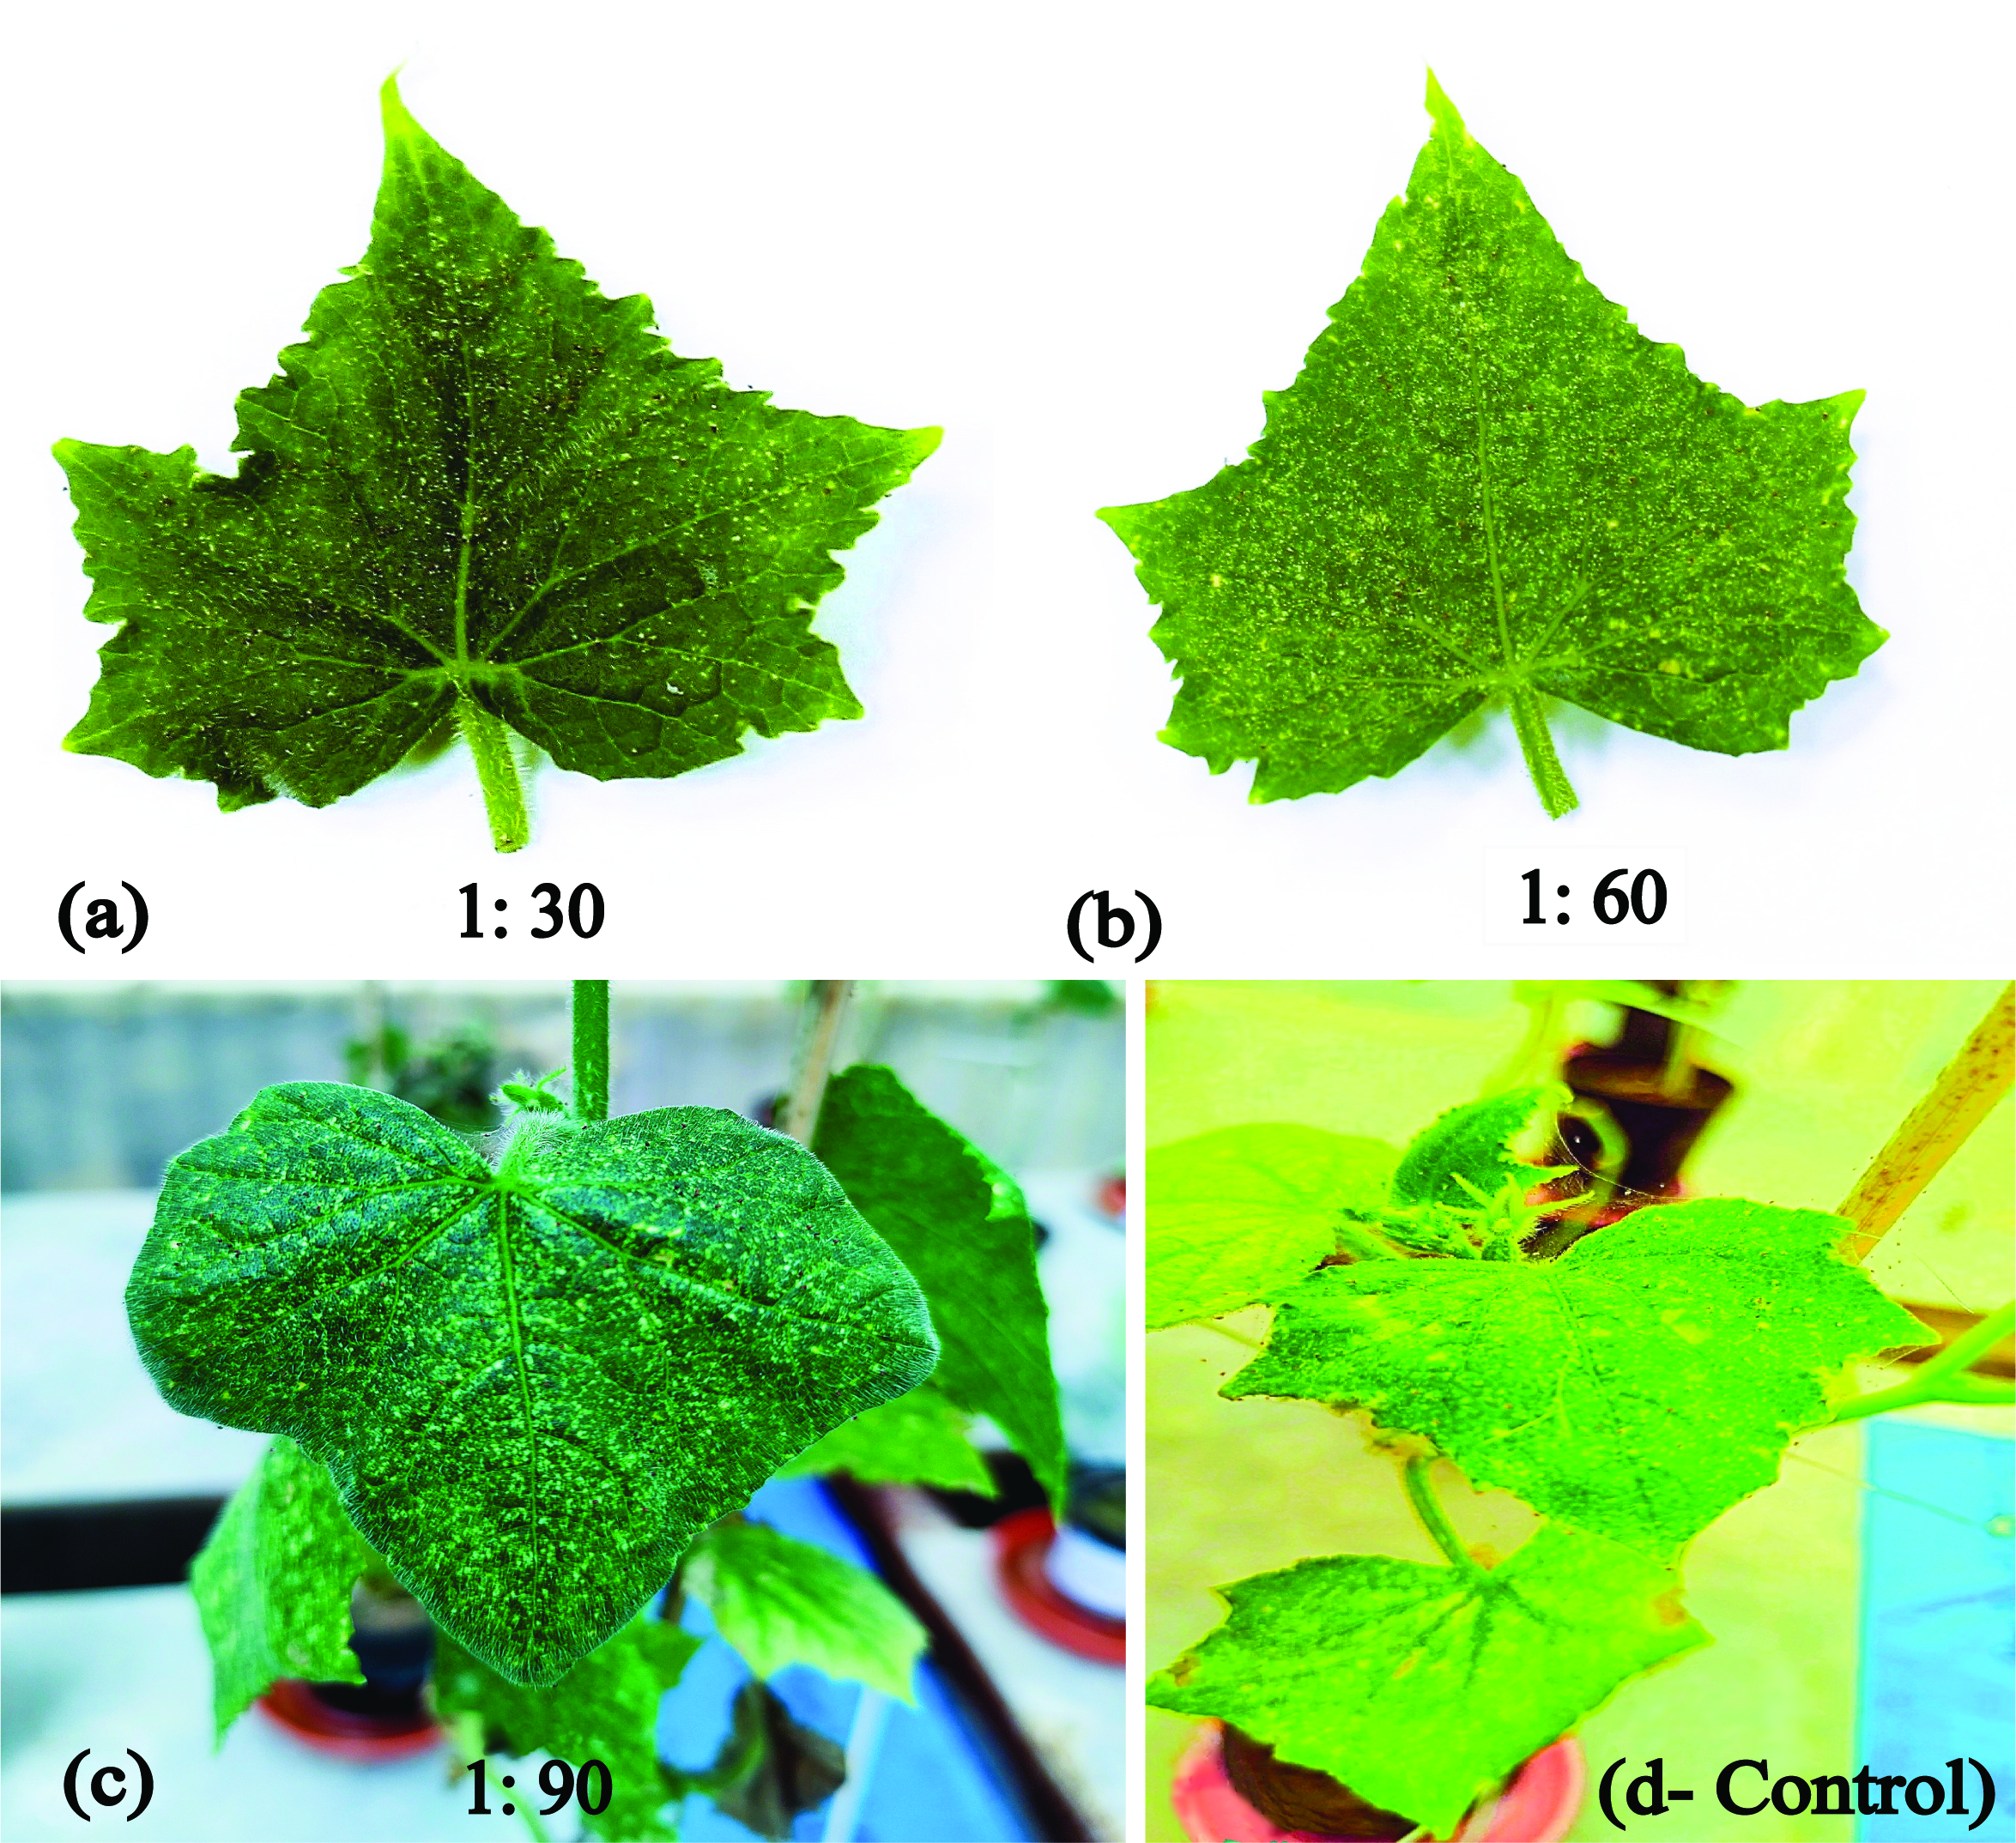
The stippling appeared on the C. sativus leaves caused by the T. urticae population were less than one-third of the leaf in all treatments at the time of predator release. After 12 days, stippling increased to one-third of the leaf in the release ratio of 1:30, while it was half the leaf in the 1:60 and 1:90. Either more than half or complete discoloration was observed in the control treatment (Table 4 and Figure 2). The webbing constructed by T. urticae on the C. sativus leaves was localized/scattered in all treatments at the time of predator release. After 12 days, localized/ scattered webbing was observed in both release ratios of 1:30 and 1:60 as compared to webbing over the whole leaf in 1:90. Furthermore, webbing over the complete leaf and side branches was observed in control (Figure 2).
Discussion
The impact of using egg cards and releasing different larval instars of the predator, C. carnea, was investigated to determine the most optimal larval instar and its predator-prey release ratio by conducting two different greenhouse experiments on C. sativus crop to manage the T. urticae population and its damage to the crop. Chrysoperla carnea larval releases were comparatively more significant than egg cards in managing the T. urticae population (Table 1). Similarly, less damages to the C. sativus plant leaves were assessed in the larval release treatment as compared to the egg card release (Table 2 and Figure 1).
Tetranychus urticae population increased after 12 days of the egg card release (Table 1). The environmental conditions significantly impact on the hatching and incubation period of C. carnea eggs (Tauber et al. 2000; Sarwar 2014; Takalloozadeh 2015) (Table 1). Laboratory studies revealed that the incubation period of C. carnea eggs increased as the temperature decreased: 3.2 days at 32 °C, 6 days at 20 °C and 12 days at 15 °C with 50 ± 10% relative humidity (Ranjbar and Nemati 2020), while the average incubation period is 2.26 days at 25 ± 2 °C and 60 ± 5% relative humidity (Takalloozadeh 2015; Sattar et al. 2011). The average daily temperature and relative humidity in the present study were 21 ± 0.6 °C and 59 ± 5%, respectively.
Among the three larval instars, the 2nd instar larvae voraciously consumed the T. urticae population and contributed to maximum reduction, similarly to the 3rd instar larvae. According to Hassanpour et al. (2009), the highest T. urticae population reduction percentage is due to the larger size and low handling time of these stages. Similar results were reported by Sattar (2022) for the 3rd instar of C. carnea release in the field, against the cotton-sucking pests was found after one week. Overall, after 12 days, the 2nd and 3rd larval instars showed a significant T. urticae population reduction percentage (Table 1). It has been reported that developmental period of 3rd instar larvae is increased till 17 days when fed with motiles of T. urticae before it died (Kasap et al. 2003), but the nutritional quality of spider mites could have played a potential role in this prolonged duration (Schmidt et al. 2012). The 2nd instar larvae remained on the plants for a longer duration compared to the 3rd instar larvae and contributed more effectively to the population reduction percentage of T. urticae. The 2nd instar larvae of C. carnea showed the highest T. urticae population reduction after nine days in the greenhouse on Phaseolus vulgaris L. (Fabaceae) plants (Saleh et al. 2017). Furthermore, the releasing of C. carnea 2nd instar larvae exhibited 96.70% and 100% population reduction percentage of Aphis gossypii Glover (Hemiptera: Aphididae) after four and seven days, respectively, at a release ratio of 1:30 (Abdel-Salam et al. 2005). Similar results were also reported against the same aphid species on Solanum melongena L. (Solanaceae) (Gurbanov 1984). Similarly, the 2nd instar larvae of Chrysoperla plorabunda (Fitch) (Neuroptera: Chrysopidae) reduced 84% of the population of Russian green peach aphids, Diuraphis noxia (Mordvilko) (Hemiptera: Aphididae), after eight days of the predator release on Capsicum annum, Solanum lycopersicum, and S. melongena (all three from Solanaceae) (Messina and Sorenson 2001).
The 1st instar larvae of C. carnea depicted the lowest population reduction percentage of T. urticae. This could be due to different biological and ecological aspects. It has a low predation rate due to long handling time, and less nutritional requirement owing to a small body size (Hassanpour et al. 2009). Additionally, the glandular trichomes on C. sativus leaves may have reduced the predation rate and searching ability of the 1st instar larvae (Elsey 1974). It has been reported that the 1st instar C. carnea larvae have a lower predation rate and searching speed on tobacco leaves than on cotton (Elsey 1974). The lowest population reduction percentage on tobacco and cotton leaf by the 1st instar larvae of C. carnea was consistent with the effect of trichomes on the predation rate and searching speed (Fordyce and Agrawal 2001).
The plants infested by T. urticae, which were subsequently managed by larval releases of C. carnea, showed significantly less damage than control plants (Table 2). As a generalist predator, the predation efficiency of C. carnea could be affected by the webbing of T. urticae, especially at the time of 1st instar emergence as happens for other generalist predators (Shimoda et al. 2010; Mirza et al. 2023).
However, among the different motile stages of T. urticae, the 2nd instar larvae preferred the immature stages for foraging instead of the eggs (Sengonca and Coeppicus 1985). Based on data collected in the present experiment, there are non-significant differences in the T. urticae population among different intervals of 1:30 and 1:60 ratios, as shown (Table 3). If eggs of T. urticae were being predated, there would be a serious decline in the T. urticae population. However, the population maintained or increased very slowly. It means the predator preferred the available motile stages while eggs hatched and added more immatures to the overall T. urticae population. The feeding potential of different C. carnea larvae, revealed that larvae of C. carnea preferred the protonymph stage (Sengonca and Coeppicus 1985). Similarly, the females of the phytoseiid generalist predators, Amblyseius andersoni (Chant), Euseius findlandicus (Oudemans), and Euseius hibisci (Chant), exhibited moderately more preference for the larvae of T. urticae over the eggs (Blackwood et al. 2001). Likewise, the immature stage of the phytoseiid predator, Neoseiulus longispinosus (Evans), demonstrated a preference for the nymphal stage of Tetranychus neocaledonicus André over its eggs (Jyothis and Ramani 2019). Similar damage on plants caused by T. urticae population in the present study, has been observed in both predator-prey release ratios. This could be an indication of the high searching ability of the larvae.
At 1:90, T. urticae showed an exponential population growth rate after 12 days with the lowest reduction percentage of 24% (Table 3). The exponential growth of T. urticae created more complex/dense webbing than in 1:30 and 1:60 experiments, hindering the movement of the predator larvae. Initially, the 2nd instar larvae of C. carnea reduced the T. urticae population by primarily foraging on immatures (Sengonca and Coeppicus 1985). However, surviving T. urticae females dispersed to new leaves and established new colony patches (Van and Yurewicz 1998). These dispersed females contributed to exponential population growth in the new leaves and constructed more complex/complicated webbing which hinder the movement of the predator. The webs serve as an anti-predator function, with complex, dense webbing providing better protection from predators (Dittmann and Schausberger 2017). The predator's foraging to T. urticae was limited due to webbing over the whole abaxial surface of C. sativus leaves. In this situation, the generalist predator cannot cope with the complex, dense webbing produced by the T. urticae population. Consequently, the predator relocates to find the new patches inhabited by the T. urticae population with comparatively low webbing. However, without the predator, the population of T. urticae thrives and exploits the plants (Kuchlein 1966; Sabelis 1982).
Similarly, in the damage assessment of this experiment, webbing was observed over the whole leaf at 1:90 (predator/prey ratio) after the 12 days of the predator release (Table 4). The T. urticae damage to C. sativus plants is directly related to the visual yellow spots (stippling) and webbing density (Tables 3 and 4, Figure 2). The plants infested with T. urticae managed by higher C. carnea release ratios, had significantly less damage than the control. In support of the present experiment, Phytoseiulus persimilis Athias-Henriot released with release ratios of 1:10 and 3:10 showed less damage and stippling at high release ratios on the Lima bean (Phaseolus lunatus L.) crops in the greenhouse (Amoah et al. 2016).
The outcomes of the present study indicate that the use of C. carnea larval instars is more effective than releasing its egg card. However, egg cards could be used at low levels of spider mite infestations. As compared to all three instars of C. carnea, the 2nd instar larvae have the potential for the management of T. urticae in greenhouses between the release ratio of 1:30 to 1:60. Simultaneously, these release ratios significantly reduced the visual and webbing damage of T. urticae on cucumber plants. In this way, these predators could provide pest management for an extended time. Clearly, repeated releases of 2nd instar larvae to explore time intervals and cost-effective techniques for the management of T. urticae and other greenhouse pests would be desirable.
Funding
This project was funded by the National Plan for Science, Technology, and Innovation (MAARIFAH), King Abdul-Aziz City for Science and Technology, Kingdom of Saudi Arabia, Award Number (3-17-07-001-0005).
Data Availability Statement
All necessary data for the manuscript is provided.
Acknowledgments
We are thankful to the researchers of Acarology and Biological Control Research and Development Laboratory, Department of Plant Protection, King Saud University, for their help in the experimentation.
Conflicts of Interest
The authors declare no conflict of interest.
References
- Alatawi F.J. 2011. Phytophagous and predaceous mites associated with vegetable crops from Riyadh, Saudi Arabia. Saudi J. Biol. Sci., 18(3): 239-246. https://doi.org/10.1016/j.sjbs.2011.02.004
- Alatawi F.J., Kamran M. 2018. Spider mites (Acari: Tetranychidae) of Saudi Arabia: two new species, new records and a key to all known species. J. Nat. Hist., 52(7-8), 429-455. https://doi.org/10.1080/00222933.2018.1434251
- Alghamdi A., Sayed S. 2017. Biological Characteristics of Indigenous Chrysoperla carnea (Neuroptera: Chrysopidae) Fed on a Natural and an Alternative Prey. Asian J. Biol., 2(2): 1-6. https://doi.org/10.9734/AJOB/2017/32296
- Abbott W.S. 1925. A method of computing the effectiveness of an insecticide. J. econ. Entomol, 18(2): 265-267. https://doi.org/10.1093/jee/18.2.265a
- Abdel-Salam A.H., Ragab M.E., El-Batran L.A., Ahmed, A.R. 2005. Release of Coccinella undecimpunctata L. and Chrysoperla carnea (Stephesn) as a Biological Control tool of the Cotton Aphis, Aphis gossypii Glover on Tomotao Plants under Field Cage Conditions. JPPP, 30(1): 655-669. https://doi.org/10.21608/jppp.2005.238601
- Amoah B., Anderson J., Erram D., Gomez J., Harris A., Kivett J., Nechols J. 2016. Plant spatial distribution and predator-prey ratio affect biological control of the two-spotted spider mite Tetranychus urticae (Acari: Tetranychidae) by the predatory mite Phytoseiulus persimilis (Acari: Phytoseiidae). Biocontrol Sci., 26(4): 548-561. https://doi.org/10.1080/09583157.2015.1133807
- Blackwood J.S., Schausberger P., Croft B.A. 2001. Prey-stage preference in generalist and specialist phytoseiid mites (Acari: Phytoseiidae) when offered Tetranychus urticae (Acari: Tetranychidae) eggs and larvae. Environ. Entomol., 30(6): 1103-1111. https://doi.org/10.1603/0046-225X-30.6.1103
- Dittmann L., Schausberger P. 2017. Adaptive aggregation by spider mites under predation risk. Sci. rep., 7(1): 10609. https://doi.org/10.1038/s41598-017-10819-8
- Elsey K.D. 1974. Influence of plant host on searching speed of two predators. Entomophaga, 19(1): 3-6. https://doi.org/10.1007/BF02371503
- Fordyce J.A., Agrawal A.A. 2001. The role of plant trichomes and caterpillar group size on growth and defense of the pipevine swallowtail Battus philenor. J. Anim. Ecol., 70(6): 997-1005. https://doi.org/10.1046/j.0021-8790.2001.00568.x
- Gautam R.D., Tesfaye A. 2002. Potential of green lacewing Chrysoperla carnea (Stephens) in crop pest management. New Agriculturist., 13: 147-158. https://www.cabidigitallibrary.org/doi/full/10.5555/20033165241
- Gurbanov G.G. 1984. Effectiveness of the use of the common lacewing, Chrysoperla carnea (Steph.) in the control of sucking pests and cotton moth on cotton. Biology Nauk, 2: 92- 93. https://www.cabidigitallibrary.org/doi/full/10.5555/19840520668
- Hassanpour M., Nouri-Ganbalani G., Mohaghegh J., Enkegaard, A. 2009. The functional response of different larval instars of the green lacewing, Chrysoperla carnea (Neuroptera: Chrysopidae), to the two-spotted spider mite, Tetranychus urticae (Acari: Tetranychidae). J. of Food Agric. And Environ., 7(2): 424-428. https://doi.org/10.1234/4.2009.1678
- Hölzel H, 1980. Fauna of Saudi Arabia. In: Wittmer M., Buttiker W., Talhouk A.S., (2nd eds). Insects of Saudi Arabia. Neuroptera: Fam. Chrysopidae. 164-173. https://doi.org/10.2307/1446464
- Imam I I., Nawar M.A. 2020. Biological control using some predators for tomato pests under greenhouse conditions. Egypt. Acad. J. Biol. Sci., 13(1): 165-171. https://doi.org/10.21608/eajbsa.2020.77334
- Iqbal J., Ashfaq M. Ali A. 2008 Management of aphids by augmentation of coccinellids and Chrysoperla carnea under field conditions on wheat. Pak. J. Agri. Sci., 45(1): 57-59. https://www.cabidigitallibrary.org/doi/full/10.5555/20093026226
- Jeppson L.R., Keifer H.H., Baker E.W. 1975. Mites injurious to economic plants. University of California Press. https://doi.org/10.1525/9780520335431
- Jyothis D., Ramani N. 2019. Evaluation of prey stage preference of the predatory mite Neoseiulus longispinosus (Evans) on the spider mite pest Tetranychus neocaledonicus (André) (Acari: Phytoseiidae: Tetranychidae). Acarologia, 59(4): 484-491. https://doi.org/10.24349/acarologia/20194347
- Kasap I., Aktug Y. Atlıhan R. 2003. Avcı Böcek Chrysoperla carnea (Stephens) (Neuroptera: Chrysopidae)′nın Bazı Biyolojik Özellikleri Üzerine Araştırmalar. YYU J Agri. Sci., 13(1): 49-53.
- Khan H.A.A., Sayyed A.H., Akram W., Raza S., Ali M. 2012. Predatory potential of Chrysoperla carnea and Cryptolaemus montrouzieri larvae on different stages of themealybug, Phenacoccus solenopsis: A threat to cotton in South Asia. J. of insec. Sci., 12(147): 1-12. https://doi.org/10.1673/031.012.14701
- Kuchlein J.H. 1966. Some aspects of the predator-prey relation. Ecology of Aphidophagous Insects (I. Hodek, Ed.), 237-242.
- Letardi A., Abdel-Dayem M.S., Al-Dhafer H.M. 2020. New faunal data on lacewings (Insecta, Neuroptera) collected from Saudi Arabia. ZooKeys, 936: 111. https://doi.org/10.3897/zookeys.936.49962
- Mena Y.M., Mesa N.C., Escobar A., Pérez S. 2020. Evaluation of Phytoseiidae mites and Chrysoperla carnea (Stephens) on the control of Tetranychus urticae in Carica papaya L. Agron. Colomb., 38(1): 101-109. https://doi.org/10.15446/agron.colomb.v38n1.73271
- Messina F.J., Sorenson S.M. 2001. Effectiveness of lacewing larvae in reducing Russian wheat aphid populations on susceptible and resistant wheat. Biological control, 21(1): 19-26. https://doi.org/10.1006/bcon.2000.0914
- Mirza J.H., Kamran M., Alatawi F.J. 2023. Behavioral Response of a Specialist Predator, Stethorus gilvifrons (Coccinellidae: Coleoptera), to Cope with Web Structures of Four Different Spider Mite Pest Species. Agriculture, 13(3): 582. https://doi.org/10.3390/agriculture13030582
- New T.R. 2002. Prospects for extending the use of Australian lacewings in biological control. Acta Zool. Acad. Sci. Hung. 48(2): 209-216.
- Ranjbar A.H., Nemati Z. 2020. Modeling of the effect of temperature on developmental rate of common green lacewing, Chrysoperla carnea (Steph.) (Neuroptera: Chrysopidae). EJBPC, 30, 1-10. https://doi.org/10.1186/s41938-020-00341-x
- Sabelis M.W. 1982. Biological Control of Two-Spotted Spider Mites Using Phytoseiid Predators. Part I. Pudoc. Ph.D. Thesis, Wageningen University and Research, Wageningen, The Netherlands. https://doi.org/10.18174/206549
- Sarwar M. 2013. Management of spider mite Tetranychus cinnabarinus (Boisduval)(Tetranychidae) infestation in cotton by releasing the predatory mite Neoseiulus pseudolongispinosus (Xin, Liang and Ke)(Phytoseiidae). Biological Control, 65(1): 37-42. https://doi.org/10.1016/j.biocontrol.2012.09.017
- Sarwar M. 2014. The propensity of different larval stages of lacewing Chrysoperla carnea (Stephens) (Neuroptera: Chrysopidae) to control aphid Myzus persicae (Sulzer) (Homoptera: Aphididae) evaluated on Canola Brassica napus L. SJST, 36(2). https://www.cabidigitallibrary.org/doi/full/10.5555/20143188512
- Salama, Z.SN., Emam A.K., Gaffar S.A., Hanafy M.E.H. 2016. Reductions of Myzus persicae and Bemisia tabaci numbers using Coccinella septempunctata and Chrysoperla carnea predators on tomato plants under greenhouse conditions in Egypt.
- Saleh F.M., Tawfik A.A., Elsherbeni M.K. 2017. Release of Chrysoperla carnea (Stephens) (Neuroptera: Chrysopidae) as a Biological Control Agent against Tetranychid Mites, Tetranychus urticae (Koch), on Phaseolus vulgaris L. Plantations under Semi Field Conditions. JPPP, 2017, 8(12): 615-617. https://doi.org/10.21608/jppp.2017.46927
- Sattar M., Abro G.H., Syed T.S. 2011. Effect of different hosts on biology of Chrysoperla carnea (Stephens) (Neuroptera: Chrysopidae) in laboratory conditions. Pak. J. Zool. 43(6). https://www.cabidigitallibrary.org/doi/full/10.5555/20123135213
- Sattar M. 2022. Field Release Performance of Chrysoperla Carnea for Population Management of Sucking Insect Pests of Cotton. JN, 3(1): 69-83. https://doi.org/10.52700/jn.v3i1.55
- Schmidt J.M., Sebastian P., Wilder S.M., Rypstra A.L. 2012. The nutritional content of prey affects the foraging of a generalist arthropod predator. PLoS ONE. 7: e49223. https://doi.org/10.1371/journal.pone.0049223
- Sengonca C., Coeppicus S. 1985. Feeding activity of Chrysoperla carnea (Stephens) compared to Tetranychus urticae Koch.[German]. ZFAZ. https://doi.org/10.1111/j.1439-0418.1985.tb02773.x
- Shakoor, M. W., Mirza, J. H., Kamran, M., & Alatawi, F. J. (2024). Lifecycle Completion and Reproductive Improvement of Chrysoperla carnea (Stephens)(Neuroptera: Chrysopidae), Following a Prey Shift Routine During Larval Development. Biology, 14(1), 10. https://doi.org/10.3390/biology14010010
- Shimoda T., Kishimoto H., Takabayashi J., Amano H., Dicke M. (2010). Relationship between the ability to penetrate complex webs of Tetranychus spider mites and the ability of thread-cutting behavior in phytoseiid predatory mites. Biological Control, 53(3): 273-279. https://doi.org/10.1016/j.biocontrol.2010.02.007
- Suekane R., Degrande P.E., Melo E.P.D., Bertoncello T.F., Lima Junior I.D.S.D., Kodama C. 2012. Damage level of the two-spotted spider mite Tetranychus urticae Koch (Acari: Tetranychidae) in soybeans. Revista Ceres, 59: 77-81. https://doi.org/10.1590/S0034-737X2012000100011
- Takalloozadeh H.M. 2015. Effect of different prey species on the biological parameters of Chrysoperla carnea (Neuroptera: Chrysopidae) in laboratory conditions. J. Crop Prot., 4(1): 11-18. http://jcp.modares.ac.ir/article-3-7334-en.html
- Tauber M.J., Tauber C.A. 1993. Adaptations to temporal variation in habitats: categorizing, predicting, and influencing their evolution in agroecosystems. Evolution of insect pests: patterns of variation. Wiley, New York, 103-127.
- Tauber M.J., Tauber C.A., Daane K.M., Hagen K.S. 2000. Commercialization of predators: recent lessons from green lacewings (Neuroptera: Chrysopidae: Chrosoperla). Americ. Entomol., 46(1): 26-38. https://doi.org/10.1093/ae/46.1.26
- Van B.J., Yurewicz K.L. 1998. Effects of predators on prey growth rate: relative contributions of thinning and reduced activity. Oikos, 20-28. https://doi.org/10.2307/3546913
- Wafaa O.G., Eid F.M.H. 2008. Release of Chrysoperla cornea (Stephens) (Neuroptera: Chrysopidae) and the predacious mite, Phytoseiulus macropilis (Banks) (Acari: Phytosiidae) to control, Tetranychus urticae Koch (Acari: Tetranychidae) in greenhouse in Egypt. EJBPC, 18(2): 381-384. https://www.cabidigitallibrary.org/doi/full/10.5555/20093095766
- Zia K., Hafeez F., Khan R.R., Arshad M., Naeem-ullah U. 2008. Effectiveness of Chrysoperla carnea (Stephens) (Neuroptera: Chrysopidae) on the population of Bemisia tabaci (Homoptera: Aleyrodidae) in different cotton genotypes. J Agri. Soc. Sci., 4(3): 112-116. https://www.cabidigitallibrary.org/doi/full/10.5555/20083237898


2024-12-09
Date accepted:
2025-08-06
Date published:
2025-08-11
Edited by:
Tsolakis, Haralabos

This work is licensed under a Creative Commons Attribution 4.0 International License
2025 Ali, Hafiz Muhammad Sajid; Kamran, Muhammad and Alatawi, Fahad Jaber
 Download article
Download the citation
RIS with abstract
(Zotero, Endnote, Reference Manager, ProCite, RefWorks, Mendeley)
RIS without abstract
BIB
(Zotero, BibTeX)
TXT
(PubMed, Txt)