


Edaphic characteristics and environmental impact of rubber tree plantations on soil mite (Acari) communities
N’Dri, Julien K.1 ; Pokou, Pacôme K. 2 ; Séka, Fabrice A.3 ; N’Da, Rodolphe A. G.4 and Lagerlöf, Jan5
1✉ Unité de Formation et de Recherche (UFR) des Sciences de la Nature,Université Nangui Abrogoua, 02 BP 801 Abidjan 02, Côte d’Ivoire & Centre de Recherche en Ecologie (CRE), 08 BP 109 Abidjan 08, Côte d’Ivoire.
2Unité de Formation et de Recherche (UFR) des Sciences de la Nature,Université Nangui Abrogoua, 02 BP 801 Abidjan 02, Côte d’Ivoire.
3Unité de Formation et de Recherche (UFR) des Sciences de la Nature,Université Nangui Abrogoua, 02 BP 801 Abidjan 02, Côte d’Ivoire.
4Unité de Formation et de Recherche (UFR) des Sciences de la Nature,Université Nangui Abrogoua, 02 BP 801 Abidjan 02, Côte d’Ivoire.
5Swedish University of Agricultural Sciences (SLU), Dept. of Ecology, P.O.Box 7044, SE-750 07 Uppsala, Sweden.
2018 - Volume: 58 Issue: 4 pages: 951-962
https://doi.org/10.24349/acarologia/20184300Keywords
Abstract
For half a century, cocoa, coffee, oil palm and rubber trees have been the major perennial crops cultivated in Côte d’Ivoire (Ruf 2000). However, rubber production has increased remarkably since 2000, due to the increase of purchase price. Similar to cocoa productions (Tondoh et al. 2015), rubber plantations have potentially negative effects on soil quality as demonstrated in Thai plantations (Yi et al. 2014). The soil degradation and loss of productivity related to agricultural practices are two problems observed in several countries (Yi et al. 2014; Tondoh et al. 2015). All terrestrial ecosystems consist of aboveground and belowground biodiversity that interact to influence the community and the process at different levels (Wardle et al. 2004). Soil degradation results in plant diversity and species richness loss due to the disappearance of a huge number of native species and the significant decline in organic carbon and total nitrogen (Tondoh et al. 2015). Indeed, the forests present a complex structure with heterogeneity of sources of organic residues due to vegetation composed of several species of trees (Martius et al. 2004). However, over time some agrosystems provide favorable niches and conditions for soil biodiversity (Dash and Behera 2013) and can perform ecological functions identical to those of a forest (Martius et al. 2004).
Soil organisms, particularly mites are an extremely diverse group which have successfully adapted to a wide range of habitats (Eisenbeis 2006). They are sensitive to environmental conditions and disturbance of the habitat, which may make them useful as bioindicators (Kay et al. 1999). Mites were chosen as the indicator fauna because they are the only component of the soil fauna that remains active in dry soils (Whitford 1989). They are very active in maintaining soil fertility through their activities of decomposition and nutrient renewal (Acharya et al. 2014). It is well established that most of mites prefer stable ecosystems and habitats rich in organic matter (Behan-Pelletier 1999; Gulvik 2007). However, being characterized by a low dispersal (Berthet 1964; Lindo and Visser 2004), their abundance and diversity can be significantly affected by the different land use types (Singh and Ray 2015).
Traditionally, the evaluation of the soil quality was based on physical and chemical parameters (Coja and Bruckner 2006), but recently a more ecological approach has been used which considers characteristics of the soil fauna and the structure of their communities (Coja and Bruckner 2006). The Maturity Index (Ruf 1998) based on ranking Gamasid mites according to their life-history traits r/K scale has been adopted as a bioindication tool and a more integrative measure of environmental impact in forest ecosystems. The Gamasid mites with K selection exhibit a slow life cycle, low egg deposition rate, and small numbers of offspring. They inhabit stable habitats and their potential to colonize new sites is limited (Eisenbeis 2006; Moraza and Hernández 2016). However, the Gamasid mites with r selection have high reproduction, short life cycle, rapid juvenile development, high egg deposition rates and high numbers of offspring. r strategists often inhabit disturbed habitats (Eisenbeis 2006).
In Côte d’Ivoire, the use of soil mites as bioindicators was devoted to forest, savannah and teak plantations (N’Dri et al. 2016), but without the integration of a chronosequence aspect in the sampling design. No studies have been carried out on the biodiversity of soil mites and their role as bioindicators of the ecological status of the rubber chronosequence. The objective of this study was to evaluate the response of different mite taxa across the land use types using environmental metrics and to determine the utility of mites as indicators of environmental change after conversion of secondary forests into rubber plantations. Specifically, we examined (i) soil mites’ abundance, diversity and community structure, (ii) soil physico-chemical variables and the Maturity Index, which will be considered as an indicator of environmental change, and (iii) relationships between communities of mites and environmental parameters.
The study was carried out in the Department of Grand-Lahou (5°13’ N; 5°03’ W) situated in southern Côte d’Ivoire at 140 km west of Abidjan. The climate of this zone is equatorial with four seasons: a long dry season, from December to March; a long wet season, from April to July; a short dry season, from August to September and a short wet season, from October to November (Konan et al. 2013). The annual rainfall during the study (2013) was 1,085 mm and the average monthly temperature was 27 °C. The vegetation is rainforest with mosaic aspects (Ettian et al. 2009). The Gobodienou forest (59,800 ha) is one of the main protected areas of Grand-Lahou. Agricultural activities are much developed due to omnipresence of perennial crops (Konan et al. 2013). The conversion of natural forests into plantation is widely practiced in the study area. Farmers asserted that most of the area we studied was secondary forest since 1980 (33 years before). A part of the previous vegetation of rubber plantations was used as cocoa, coffee or oil palm plantations in the former rotation, and was converted to rubber plantations from 1988. Immature and mature rubber plantations grow together over a period which does not exceed 25 years. The vegetation cover increases with the aging of rubber plantations. The cultivated species is Hevea brasiliensis. Elaeis guineensis (Arecaceae) up to 1 m, Pueraria phaseoloides (Papilionaceae), Thaumatococcus daniellii (Marantaceae), Uapaca guineensis (Euphorbiaceae), and Turraeanthus africanus (Meliaceae) comprised undergrowth plant species in rubber plantations. The soils are ferrallitic.
The sampling was performed during the dry season in 2013, on 12 sampling areas consisting of four land use types: secondary forests, 7-year-old rubber plantations, 12-year-old rubber plantations, and 25-year-old rubber plantations. These four land use types were defined as the chronosequence. Three replications of each land use type were distributed upstream and downstream of the Bandama river. The secondary forests were considered as control plots. The rubber plantations areas varied from 1 to 2 ha while those of forest ranged between 5 and 10 ha. The sampling areas were 1-3 km distant from one another. On each of the 12 sampling areas, five sampling points were allocated at every 10 m intervals along a 40 m transect established in the center of the plots. Soil cores were taken with a steel corer (Ø 5 cm) at 0-10 cm soil depth (Bedano and Ruf 2007). At each sampling point, two adjacent soil cores including litter thickness were taken for a total of 10 soil cores per transect. In total, 120 soil cores were taken across the 12 sampling areas and brought to the laboratory in plastic packets. These soil cores were intended for the extraction of mites by using a modified Berlese-Tullgren funnel during 10 days (Bedano and Ruf 2007). The soils for chemical analysis were sampled according to the Tropical Soil Biology and Fertility method recommended by Anderson and Ingram (1993). The composite soil samples were obtained from five cores taken in quadrats (50 × 50 × 10 cm) and at 50 cm from the sampling point. On each sampling area and following the 40 m transect, three composite soil samples were taken with 20 m intervals between two consecutive points. Along the same transect, three soil cores (non-composite samples) were taken with 20 m intervals between two consecutive points using the cylinder method (Assié et al. 2008) for physical measurements. A total of 36 composite soil samples and 36 non-composite soil samples were taken for the physico-chemical measurements.
All adult mites from the samples were mounted on cavity slides containing 85% lactic acid solution. Darker and more robust species of Oribatid mites were cleared in 85% lactic acid solution for 24-72 hours, depending upon the level of sclerotization of each species. The identification was made with a digital camera VC.5000 mounted on a NOVEX light microscope. All adult mites were identified to family, genus and morphospecies levels by using available taxonomic keys and descriptions provided in Balogh and Balogh (1992a,b), Krantz and Walter (2009) and Walter et al. (2013). Thus, the modern classification of mites given in Krantz and Walter (2009) was applied.
The abundance of soil mites was characterized by the density and expressed as mean of individuals per square meter. The diversity of soil mite was assessed by using mean species richness, Shannon index and Evenness. The mean species richness in a local assemblage is an intuitive and natural index of community structure. It shows the patterns of species richness measured at both small and large spatial scales. The Shannon index is commonly used to characterize species diversity in a community. Evenness refers to the distribution of individuals over species. The calculation of diversity or evenness indices is perceived as descriptors of community structure and must be complemented with information on ecological functioning (Heip et al. 1998). All biological parameters were calculated with a data matrix of 70 morphospecies. A particular interest was devoted to Gamasid and Oribatid mites due to their abundance and their key role in the ecosystem functioning. The community structure was analyzed by using the dominant species (Badejo and Ola-Adams 2000; N’Dri et al. 2016). However, due to the low abundance of soil mites observed in our data, the species that provided 3% or more of the total abundance of mites in each land use type was regarded as dominant (N’Dri et al. 2016). The occurrence of lower and higher Oribatida was also analysed.
The Maturity Index MI is a sensitive bioindication tool and an integrative measure of environmental impact in forest ecosystems (Ruf 1998). The MI for the Gamasid mites is calculated as the weighted proportion of K-selected genera in the whole community (Ruf 1998). This system is based on ranking Gamasid mite taxa according to their life-history traits on an r/K scale, with values ranged from 1 to 4 for r-strategy and from 1 to 3 for K-strategy. The assignation of K or r values to families of Gamasida was applied according to the egg-laying rate per day and development rate (Ruf 1998). The minimum index value of the MI is zero (no K strategists in the site), and the maximum value is 1 (all species are K strategists). The less the soil and environment are disturbed, the greater the value of the Maturity Index.

where S is the species number, K the K-value for the family of species i, and r is the r-value for the family of species i.
The soil bulk density was performed using the cylinder method (Assié et al. 2008). The soil water content was estimated after oven-dried at 105 °C for 48h whereas, the soil organic carbon (SOC) was measured by the Walkley and Black (1934) method. The soil organic matter (SOM) was estimated through the formula SOC x 1.7 (Noti et al. 2003). Soil degradation index data was provided by Séka (2015).
As the data did not follow a normal distribution (Shapiro-Wilk test), the impact of land use types on mite density was estimated by using Kruskal-Wallis test. A one-way ANOVA associated with the post-hoc Tukey’s test was performed to examine respectively land use types impact on the soil physico-chemical parameters and mite diversity indices. The same test was applied to the abundance of Gamasida and Oribatida groups after log (x+1) transformation of the data. The correlations were performed across the rubber chronosequence and between the mite community structure and the soil characteristics. All tests were conducted by using the software Statistica 7.1. (StatSoft Inc., Tulsa, USA). The cumulative species richness (Sob) from each land use type was computed by using the software EstimateS 7.5 (Colwell 2005). The first Jackknife (Jack 1) non parametric estimator was used to estimate the expected species after 500 randomizations.
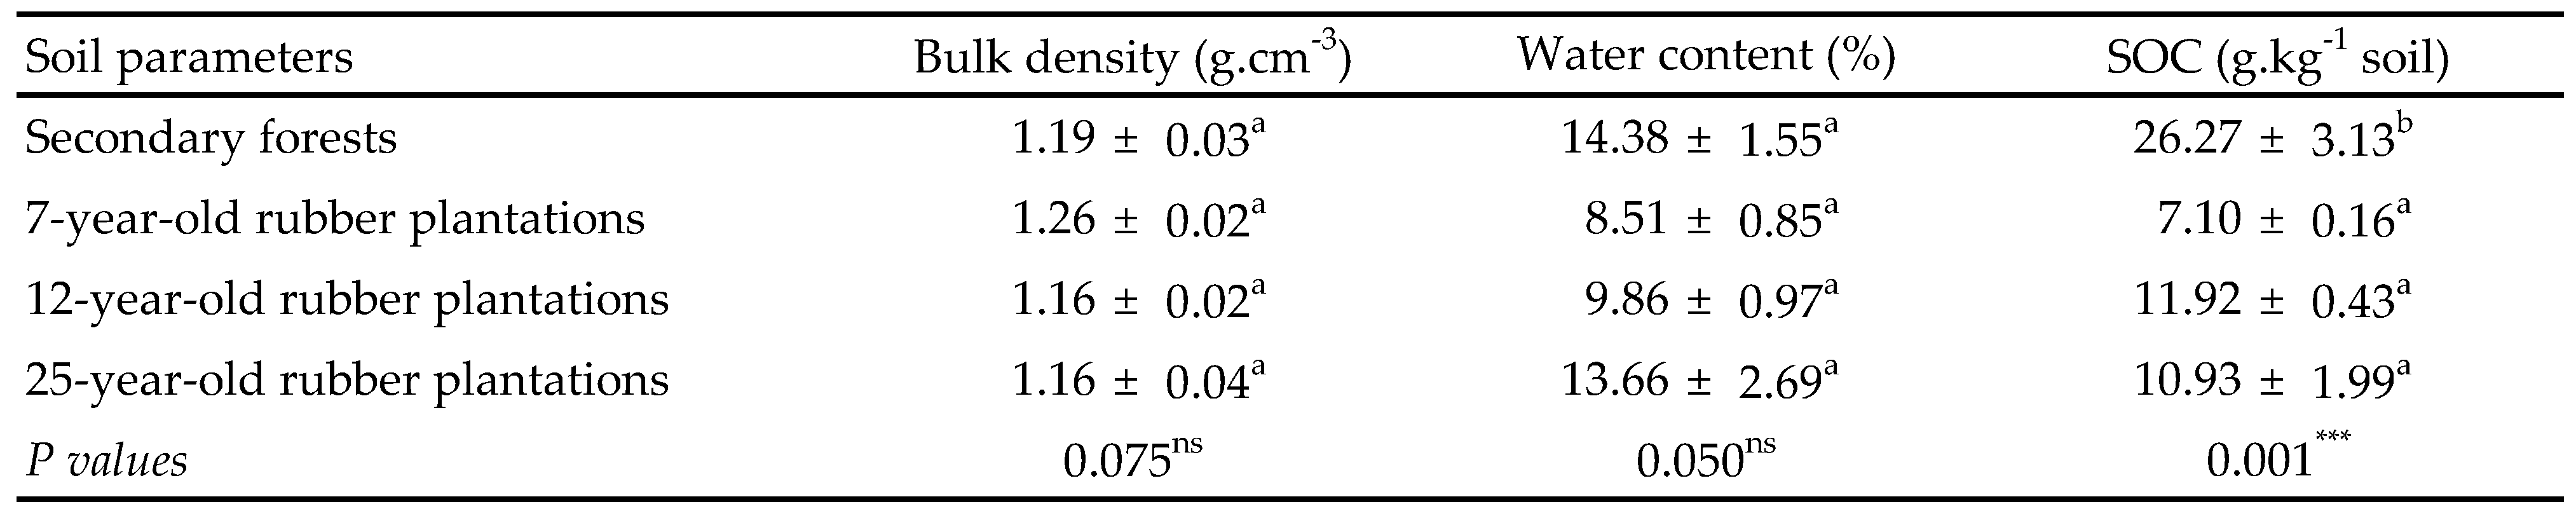
The mean value of bulk density (one-way ANOVA; F = 2.52, P = 0.075) and the soil water content (one-way ANOVA; F = 2.89, P = 0.050) was not significantly modified across the land use types (Table 1). The bulk density was the highest in 7-year-old rubber plantation (1.26 ± 0.02 g.cm-3) while soil water content was the highest in secondary forest (14.38 ± 1.55%). The amount of soil organic carbon differed significantly (one-way ANOVA; F = 20.14, P = 0.001) through the land use types. The highest value of organic carbon (26.27 ± 3.13 g.kg-1 soils) was recorded in secondary forest.

The density of soil mites varied significantly along the land use types (Kruskal-Wallis test, P = 0.001). The density of mites was lower in secondary forest and increased with the aging of rubber plantations: 2282 ± 309 individuals m-2 in 7-year-old rubber plantations vs. 4060 ± 913 individuals m-2 in 25-year-old rubber plantations (Figure 1). The abundance of Oribatida changed significantly (Kruskal-Wallis test, P = 0.009) across the land use types, but the abundance of Actinedida (Kruskal-Wallis test, P = 0.786) and Gamasida (Kruskal-Wallis test, P = 0.536) did not differ significantly. The greatest abundance of Oribatida (120 ± 0.96 individuals) and Gamasida (21 ± 0.22 individuals) was observed in 25-year-old rubber plantations.


The species richness consisted of 70 morphospecies. A total of 28, 25, 30, and 37 mite species were collected, respectively, in secondary forests, and in 7-, 12-, and 25-year-old rubber plantations. The mean species richness (one-way ANOVA; F = 2.441, P = 0.067) and Shannon index (one-way ANOVA; F = 1.926, P = 0.129) did not differ significantly through the land use types (Table 2), whereas evenness was significantly different (one-way ANOVA; F = 3.330, P = 0.022). The mean species richness (2.7 ± 0.43 species) was higher in 25-year-old rubber plantations while the Shannon index (0.75 ± 0.11) and evenness (0.71 ± 0.08) were greater in 12-year-old rubber plantations. In total, 18 species of Gamasida and 48 species of Oribatida were recorded along the land use types.


The community structure of soil mites was modified after the conversion of secondary forest into rubber plantations. 22 dominant species were observed along the land use types (see Supplementary material: Appendix). Seven, 6, 5 and 12 species of Gamasida were recorded, respectively, in secondary forests, and in 7-, 12-, and 25-year-old rubber plantations. The community of Gamasida was composed of three groups (Heatherellina, Gamasina and Uropodina). However, the group of Heatherellina was characterized by a single individual, and for this reason it was not taken into account in the statistical analysis. Unlike the Gamasina (one-way ANOVA; F = 0.11, P = 0.951), the abundance of Uropodina (one-way ANOVA; F = 2.75, P = 0.048) varied significantly along the land use types. The highest total abundance of Gamasina (4 individuals) and Uropodina (18 individuals) was recorded, respectively, in 7-, and 25-year-old rubber plantations. The abundance of Uropodina increased with the aging of the rubber plantations (Figure 2A). 19, 18, 23, and 24 species of Oribatida were recorded, respectively, in secondary forests, and in 7-, 12-, and 25-year-old rubber plantations. The community of Oribatida was comprised of four groups (Palaeosomata, Mixonomata, Desmonomata and Brachypylina). Apart from Palaeosomata (one-way ANOVA; F = 0.99, P = 0.395), Mixonomata (one-way ANOVA; F = 1.59, P = 0.193) and Desmonomata (one-way ANOVA; F = 1.25, P = 0.294), the abundance of Brachypylina significantly differed (one-way ANOVA; F = 4.51, P = 0.004) along the land use types. The highest total abundance of Desmonomata (2 individuals), Palaeosomata (2 individuals), Mixonomata (9 individuals) and Brachypylina (112 individuals) was observed, respectively, in secondary forests and in 7-, 12-, and 25-year-old rubber plantations. The abundance of Brachypylina mites increased with the aging of the rubber plantations (Figure 2B).


The families used for the assignation of r or K-values are presented in Table 3. About 11% of the Gamasid species could not be assigned r or K-values because their families were not classified. The majority of the species were K strategists, most of them 3 K (Figure 3). The life history classes 1 K, 2r and 3r were not detected in the material. The Maturity Index values increased with the increasing age of rubber plantations (Table 4). In other words, the severity of environmental impact decreased with the aging of the rubber plantations and was ranked as follows: 25-year-old rubber plantations < secondary forest < 12-year-old rubber plantations < 7-year-old rubber plantations.


Apart from the significant correlation between the Maturity Index (R = 0.432, P = 0.024), Soil degradation index (R = -0.432, P = 0.024) and the abundance of Uropodina, the other groups of Gamasida were not significantly correlated with soil characteristics (Table 5). Except for the significant correlation observed between the soil water content (R = 0.589, P = 0.001), bulk density ( R = -0.545, P = 0.003) and the abundance of Mixonomata, the others groups of Oribatida were not significantly correlated with soil characteristics.


The conversion of secondary forests into rubber plantations was characterized by a changes in mite density (+103 and +262%), species richness (-11 and +32%), water content (-41 and -5%), bulk density (+6 and -3%) and soil organic carbon (-73 and -59%) respectively after 7 and 25 years of conversion. The study also showed an increase in mite density, species richness, soil water content, and soil organic carbon with the increasing age of rubber plantations. This trend could be attributed to vegetation coverage, which increases with the aging of rubber plantations. The work performed by Hasegawa et al. (2012) indicated that plant coverage provides favorable conditions for soil microarthropods, since the structure of the vegetation has a significant effect on soil mites through the modification of the microclimate. The almost common vegetative structure in rubber plantations (with similar herbaceous vegetation and litter composition) created conditions for the appearance of other groups of invertebrates (immature oribatids, nematodes, enchytraeids, springtails), which represent food to the predatory gamasids (Manu and Honciuc 2010).
The investigation made by Yéo (2017) on the same plantations pointed out an increase of litterfall production with the increasing age of rubber plantations (7-year-old rubber plantations: 3.88 ± 0.14 t.ha-1.yr-1, 12-year-old rubber plantations: 3.86 ± 0.71 t.ha-1.yr-1, 25-year-old rubber plantations: 5.11 ± 0.60 t.ha-1.yr-1). The large amount of soil litter allows the maintenance of soil moisture (Chaudhuri et al. 2013), and also provides food sources for the mites. The increase in soil water content and decreasing polyphenol and lignin content with the increasing age of rubber plantations (Chaudhuri et al. 2013) would enhance the decomposition process and restitution of nutrients in soil (Gréggio et al. 2008). The larger abundance of soil mites in the 25-year-old rubber plantations was due to the high occurrence of Oribatid species.
Despite the heterogeneity of the vegetation cover and the availability of nutrients, the secondary forests hosted a lower abundance and diversity compared to the 25-year-old rubber plantations. The forest fragmentation (Lindo and Visser 2004) can limit the dispersal of species that rely on phoresy mechanisms (Athias-Binche 1994) and therefore, potentially decrease the soil mite abundance and diversity. Large-bodied Oribatid species seem to be affected by the dispersal limitation, as observed by Gan (2013). Probably, the soil cores were taken away from the stumps. In fact, with increasing distance to stumps, the total number of mite species in the soil/litter matrix decreases (Kamczyc et al. 2014). Similarly, a consistent pattern of lower diversity indices and evenness in the secondary forests than in the rubber plantations was observed. In other words, the total number of individuals in the secondary forests was distributed less evenly among the species. A similar result was observed in Kenya, where Maribie et al. (2011) had recorded a higher mite density and species richness under monospecific woody plantations than in the forests.
Many studies have documented that the composition of mite communities reflects the gradient of stress in the ecosystems and indicates the status of both biodiversity and natural resources (Gulvik 2007). The Maturity Index values ranged from 0.47 to 0.84 and increased with the aging of the rubber plantations. In other words, the quality of soil and environment stability increased with the aging of the rubber plantations. The Maturity Indexes estimated in 25-year-old rubber plantations (0.84) and in secondary forests (0.74) are relatively similar and ranged close to the maximum value of 1. This indicates that both land use types are more stable as may be expected for old plantations and forests without significant disturbance. Thus, the soil degradation indexes calculated by Séka (2015) on the same land use types (0.03, 0.04, 0.08, and 0.14 respectively for secondary forest, and 25-, 12- and 7-year-old rubber plantations) confirm this assertion.
Gamasid species with r selection (dominated by colonizer species) were more common in 7-year-old rubber plantations (unstable habitat), whereas those with K selection were predominant in 25-year-old rubber plantations and in secondary forests (more stable) (Coja and Bruckner 2006). The Maturity Index from our investigation remained higher than those (0.07 to 0.21) obtained by Bedano and Ruf (2007) in different agrosystems in Colacha basin, Argentina. In their study, most of predatory mites were r selected species. The Maturity Indexes estimated by Coja and Bruckner (2006) in five natural forest reserves in eastern Austria (0.63 to 0.98) were similar to ours, and the majority of predatory mites were K selected species. Donghui et al. (2006) found 0.59 to 0.90 in natural and planted secondary forests in Jingyuetan National Forest Park, China. The work performed by Hasegawa et al. (2012) in a chronosequence of conifer plantations indicated that the Maturity Index varied from 0.17 in 4-year-old conifer plantations to 0.62 in 76-year-old conifer plantations.
It is true that the Maturity Index of Gamasid mites’ presents some limits, as highlighted by Coja and Bruckner (2006): (i) the life history traits of several Gamasid species remained unknown, and (ii) the lack of variation in r- K values from widely diverse families (Epicriidae, Eviphididae, and Machrochelidae). However, despite this, the maturity index for gamasid mites is promising for the assessment of soil quality and environmental monitoring. Contrary to other bioindication tools, the differences in frequency between dominant and rare species did not affect the performance of the index, because the presence/absence data are sufficient for calculating the index. Nevertheless, in order to avoid under estimation of the index value, a large number of soil cores should be collected for detecting the rare species.
Seven years after the conversion of secondary forests into rubber plantations, the erosion of soil mites was more pronounced as highlighted by the results of our investigation. However, in 25-year-old rubber plantations, the disturbance imposed on soil mite communities during site preparation and planting was compensated for by the increasing of the Maturity Index, over time. The community structure of soil mites was more diversified in the old rubber plantations compared to secondary forest. A trend towards recolonization of agrosystems was greater with the aging of the plantations. In order to sustainably manage the rubber plantations, it would be important (i) to identify harvesting paths in plantations for avoid total soil compaction, and (ii) advise the planting of Pueraria phaseoloides (cover crops) to improve soil quality. These two technical approaches will facilitate the reconciliation between economic interests and ecological sustainability in tropical agricultural landscapes.
We gratefully acknowledge the contributions of the farmers and of the SODEFOR’ Administrator who kindly allowed access to their land. Full thanks to Dr. Martine Kah Touao Gauze, Director of the Ecological Research Center, for hosting the project in her institute. Thanks to Drs. Martinez A. Guéi and Ettien F. Edoukou for technical assistance. This study was supported by the International Foundation for Science / Ref. D/5287-1.
Acharya S., Basu P., Majumder S. 2014. Comparative study of diversity of soil oribatid mites (Acari: Oribatida) in two different soil habitats near Kolkata, West Bengal, India. Glob. J. Sci. Front. Res., 14: 16-21.
Anderson J.M., Ingram J.S.I. 1993. Tropical Soil Biology and Fertility. A Handbook of methods (2nd ed.). CAB International, Wallingford, UK. pp. 236.
Assié K.H., Angui P., Tamia A.J. 2008. Effets de la mise en culture et des contraintes naturelles sur quelques propriétés physiques d'un sol ferrallitique au Centre Ouest de la Côte d'Ivoire: Conséquences sur la dégradation des sols. Eur. J. Sci. Res., 23: 149-166.
Athias-Binche F. 1994. La phorésie chez les acariens, aspects adaptatifs et évolutifs. CNRS, Laboratoire Arago, Université Paris VI, France. pp. 179.
Badejo M.A., Ola-Adams B.A. 2000. Abundance and diversity of soil mites of fragmented habitats in a biosphere reserve in southern Nigeria. Pesq. Agropec. Brasilia, 11: 2121-2128. doi:10.1590/S0100-204X2000001100001 ![]()
Balogh J., Balogh P. 1992a. The Oribatid Mites Genera of the World (vol. 1). The Hungarian National Museum Press, Budapest, Hungary. pp.263.
Balogh J., Balogh P. 1992b. The Oribatid Mites Genera of the World (vol. 2). The Hungarian National Museum Press, Budapest, Hungary. pp.375.
Bedano J.C., Ruf A. 2007. Soil predatory mite communities (Acari: Gamasina) in agroecosystems of Central Argentina. Appl. Soil Ecol., 36: 22-31. doi:10.1016/j.apsoil.2006.11.008 ![]()
Behan-Pelletier V.M. 1999. Oribatid mite biodiversity in agroecosystems: role for bioindication. Agric. Ecosyst. Environ., 74: 411-423. doi:10.1016/S0167-8809(99)00046-8 ![]()
Berthet P.L. 1964. Field Study of the Mobility of Oribatei (Acari), Using Radioactive Tagging. J. Anim. Ecol., 33(3): 443-449. doi:10.2307/2564 ![]()
Chaudhuri P.S., Bhattacharjee S., Dey A., Chattopadhyay S., Battacharya D. 2013. Impact of age of rubber (Hevea brasiliensis) plantation on earthworm communities of West Tripura (India). J. Environ. Biol., 34: 59-65.
Coja T., Bruckner A. 2006. The maturity index applied to soil gamasine mites from five natural forests in Australia. Appl. Soil Ecol., 34: 1-9. doi:10.1016/j.apsoil.2006.01.003 ![]()
Colwell R.K. 2005. EstimateS: Statistical Estimation of Species Richness and Shared Species from Samples. Version 7.5. Persistent URL purl.oclc.org/estimates ![]() .
.
Dash M.C., Behera N. 2013. Carbon sequestration and role of earthworms in Indian land uses: a review. The ecoscan, 7: 1-7.
Donghui W., Bai Z., Zhaoyi B., Peng C. 2006. The community characteristics of soil mites under different land uses in Changchun metropolitan area, China. Acta Ecol. Sinica, 26(1): 16-25. doi:10.1016/S1872-2032(06)60002-4 ![]()
Eisenbeis G. 2006. Biology of Soil Invertebrates. In: Konig H., Varma A. (Eds.) Soil Biology. Springer-Verlag Berlin Heidelberg. pp. 3-17.
Ettian M.K., Soulemane O., Tahou T.M. 2009. Influence du régime alimentaire sur l'intervalle de parturition des aulacodes en captivité dans la région de Grand Lahou (Côte d'Ivoire, Afrique de l'Ouest). J. Anim. Plant Sci., 4(1): 311-319.
Gan H. 2013. Oribatid mite communities in soil: structure, function and response to global environmental change. PhD. Ecology and Evolutionary Biology. University of Michigan, USA. pp. 174.
Gréggio T.C., Assis L.C., Nahas E. 2008. Decomposition of the rubber tree Hevea brasiliensis Litter at two depths. Chilean J. Agric. Res., 68: 128-135. doi:10.4067/S0718-58392008000200002 ![]()
Gulvik M.E. 2007. Mites (Acari) as indicators of soil biodiversity and land use monitoring: A review. Pol. J. Ecol., 55(3): 415-440.
Hasegawa M., Okabe K., Fukuyama K., Makino S., Okochi I., Tanaka H., Goto H., Mizoguchi T., Sakata T. 2012. Community structures of Mesostigmata, Prostigmata and Oribatida in broad-leaved regeneration forests and conifer plantations of various ages. Exp. Appl. Acarol., 59(4): 391-408 doi:10.1007/s10493-012-9618-x ![]()
Heip C.H.R., Herman P.M.J., Soetaert K. 1998. Indices of diversity and evenness. Oceanis, 24: 61-87.
Kamczyc J., Gwiazdowicz D.J., Teodorowicz E., Strzymińska K. 2014. Mites (Acari, Mesostigmata) in boreal Scots pine forest floors: effect of distance to stumps. Exp. Appl. Acarol., 64: 61-71. doi:10.1007/s10493-014-9825-8 ![]()
Kay F.R., Sobhy H.M., Whitford W.G. 1999. Soil microarthropods as indicators of exposure to environmental stress in Chihuahuan desert rangelands. Biol. Fertil. Soils, 28: 121-128. doi:10.1007/s003740050472 ![]()
Konan K.S., Kouassi K.L., Kouamé K.I., Kouassi A.M., Gnakri D. 2013. Hydrologie et hydrochimie des eaux dans la zone de construction du chenal du port de pêche de Grand-Lahou, Côte d'Ivoire. Int. J. Biol. Chem. Sci., 7(2): 819-831. doi:10.4314/ijbcs.v7i2.37 ![]()
Krantz G.W., Walter D.E. 2009. A Manual of Acarology (3rd ed.). Texas Tech University Press, Lubbock, U.S.A. pp. 815.
Lindo Z., Visser S. 2004. Forest floor microarthropod abundance and oribatid mite (Acari: Oribatida) composition following partial and clear-cut harvesting in the mixed wood boreal forest. Canadian J. For. Res., 34: 998-1006. doi:10.1139/x03-284 ![]()
Manu M., Honciuc V. 2010. Rank correlations at the level of soil mites (Acari: Gamasida; Oribatida) from Central Parks of Bucharest city, Romania. Acta Entomol. Serbica, 15(1): 129-140. Available at: http://aes.bio.bg.ac.rs/index.php/aes/article/view/112 ![]() . Date accessed: 04 Mar. 2018.
. Date accessed: 04 Mar. 2018.
Maribie C.W., Nyamasyo G.H.N., Ndegwa P.N., Mung'atu J.K., Lagerlӧf J., Gikungu M. 2011. Abundance and diversity of soil mites (Acari) along a gradient of land use types in taita taveta, Kenya. Trop. Subtrop. Agroecosyst., 13: 11-26.
Martius C., Höfer H., Garcia M.V.B., Römbke J., Hanagarth W. 2004. Litter fall, litter stocks and decomposition rates in rainforest and agroforestry sites in central Amazonia. Nutr. Cycl. Agroecosys., 68: 137-154. doi:10.1023/B:FRES.0000017468.76807.50 ![]()
Moraza M.L., Hernández M.A. 2016. The mesostigmata mite community of two japanese larch (Larix kaempferi) plantations and an oak (Quercus pyrenaica) forest in Navarra (northern Spain). Revista Ibérica de Aracnología, 28: 35-44.
N'Dri J.K., Hance T., André H.M., Lagerlöf J., Tondoh J.E. 2016. Microarthropod use as bioindicators of the environmental state: case of soil mites (Acari) from Côte d'Ivoire. J. Anim. Plant Sci., 29(2): 4622-4637.
Noti M-I., André H.M., Ducarme X., Lebrun P. 2003. Diversity of soil oribatid mites (Acari: Oribatida) from high Katanga (Democratic Republic of Congo): a multiscale and multifactor approach. Biodivers. Conserv., 12: 767-785. doi:10.1023/A:1022474510390 ![]()
Ruf A. 1998. A maturity index for predatory soil mites (Mesostigmata: Gamasina) as an indicator of environmental impacts of pollution on forest soils. Appl. Soil Ecol., 9: 447-452. doi:10.1016/S0929-1393(98)00103-6 ![]()
Ruf F. 2000. Déterminants sociaux et économiques de la replantation. Ol. Corps Gras Li., 7(2): 189-196. doi:10.1051/ocl.2000.0189 ![]()
Séka A.F. 2015. Facteurs déterminants l'abondance et la diversité des communautés d'Acariens dans les plantations villageoises d'hévéa (Hevea brasiliensis Muell., Euphorbiaceae) d'âges variés à Grand Lahou (Sud-Ouest Côte d'Ivoire). Mémoire pour l'obtention du Master en Biodiversité et Gestion Durable des Ecosystèmes. Unité de formation et de Recherche des Sciences de la Nature. Université Nangui Abrogoua, Abidjan-Côte d'Ivoire. pp. 62.
Singh L.A., Ray D.C. 2015. Effect of no-tillage and tillage on the ecology of mite, (Acarina: Oribatida) in two different farming systems of paddy field in Cachar district of Assam. J. Environ. Biol., 36: 319-333.
Tondoh JE., Kouamé F.N., Guéi A.M., Sey B., Koné A.W., Gnessougou N. 2015. Ecological changes induced by full-sun cocoa farming in Côte d'Ivoire. Glob. Ecol. Conserv., 3: 575-595. doi:10.1016/j.gecco.2015.02.007 ![]()
Walkley A., Black I.A. 1934. An examination of the Degtjareff method for determining soil organic matter and a proposed modification of the chromic titration method. Soil Sci., 34: 29-38. doi:10.1097/00010694-193401000-00003 ![]()
Walter D.E., Latonas S., Byers K. 2013. Almanac of Alberta Oribatida Part1. Ver. 2.3. The Royal Aberta Museum, Edmonton, AB.
Wardle D.A., Yeates G.W., Williamson W.M., Bonner K.I., Barker G.M. 2004. Linking aboveground and belowground communities: the indirect influence of aphid species identity and diversity on a three trophic level soil food web. Oikos, 107: 283-294. doi:10.1111/j.0030-1299.2004.13523.x ![]()
Whitford W.G. 1989. Abiotic controls on the functional structure of soil food webs. Biol. Fertil. Soils, 8: 1-6. doi:10.1007/BF00260508 ![]()
Yéo J.G. 2017. Décomposition de la litière d'hévéa (Hevea brasiliensis Muell., Euphorbiaceae) suivant une séquence d'âge dans le sud de la Côte d'Ivoire. Mémoire pour l'obtention du Master 1 en Biodiversité et Gestion Durable des Ecosystèmes. Unité de formation et de Recherche des Sciences de la Nature. Université Nangui Abrogoua, Abidjan-Côte d'Ivoire. pp. 45.
Yi Z.F., Cannona C.H., Chen J., Ye C.X., Swetnam R.D. 2014. Developing indicators of economic value and biodiversity loss for rubber plantations in Xishuangbanna, southwest China: A case study from Menglun township. Ecol. Indic., 36: 788-797. doi:10.1016/j.ecolind.2015.11.054 ![]()


2018-03-04
Date accepted:
2018-11-08
Date published:
2018-11-20
Edited by:
Roy, Lise

This work is licensed under a Creative Commons Attribution 4.0 International License
2018 N’Dri, Julien K.; Pokou, Pacôme K. ; Séka, Fabrice A.; N’Da, Rodolphe A. G. and Lagerlöf, Jan
 Download article
Download the citation
RIS with abstract
(Zotero, Endnote, Reference Manager, ProCite, RefWorks, Mendeley)
RIS without abstract
BIB
(Zotero, BibTeX)
TXT
(PubMed, Txt)